Manufacturers quote a specific Battery Capacity in Amp Hours (Ah) when promoting and advertising a Battery. However for Lead Acid Battery Technology, the available battery capacity actually varies depending on the Discharge Rate.
The higher the Discharage Rate, the lower the overall capacity is. The Discharge Rates are quoted as a “C” rate and represents how many hours it takes to fully discharge* a battery at a certain current draw.
*Full discharge means for the voltage to drop to a set voltage – usually around 10.8V but the figure is determined by the Battery Manufacturer
So a Battery will have a C100 Rating, which is the capacity if 100/th of that capacity is drawn over 100 Hours, the C20 Rating is the capacity if 1/20th is drawn over 20 Hours, the C5 Capacity if 1/5th is drawn over 5 Hours, etc. This starts to get very important if you are using devices that draw a high current, such as a powerful inverter.
The following data is from using a 4 x Leoch XR1750 AGM Battery Bank fitted in Clarence, my Safari Camperbus.
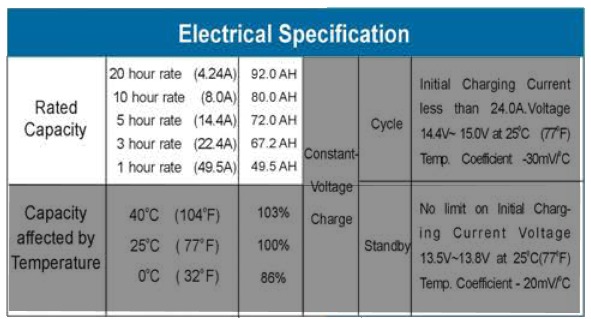
TheseXR1750 Batteries each have a nominal 110Ah Battery Capacity at the C100 Discharge Rate.
Below is the Table for the XR1750 AGM Battery Model which shows how the Rated Capacities change at different rates – from 20C to 1C are shown. And as you can see, drawing 49.5A from an XR1750 Battery would reduce the total capacity to 49.5Ah – a significant reduction from the 110Ah Headline number. (Note that this kind of reduction is not specific to this battery, but any Lead Acid battery).
(I have greyed out the bits not key for this discussion)
There is a general move to use the C20 Rating when quoting a Battery Capacity – And it certainly would be good for the same rating to be used across the board to allow the buyer to better compare between battery models without having to delve into the small print to check for like-for-like comparisions.
But the question is … is C20 the right rating to use? Why not C10? why not C100? how about a C50 Rating?
I had 4 of those XR1750 batteries in my van and that meant at the recommended C20 Rating, the capacity is worked out assuming a current draw of nearly 17A.
Now the typical person (not me!) fits multiple batteries not to allow them to draw more current, but to give them more energy over a longer period when they are off-grid camping.
This means if they double up on batteries but don’t change their useage, the appropriate “C” Rating is doubled as well – so if C20 was right for a Single Battery, then C40 would be the right rating for a pair – so doubling the batteries actually MORE THAN DOUBLES the capacity.
And if you double up again in order to further extend your off-grid battery life (so having 4 batteries), that recommended C20 Rating you should supposedly base your choice on is void and the Rated Capacity to go on is actually the C80 Rating!
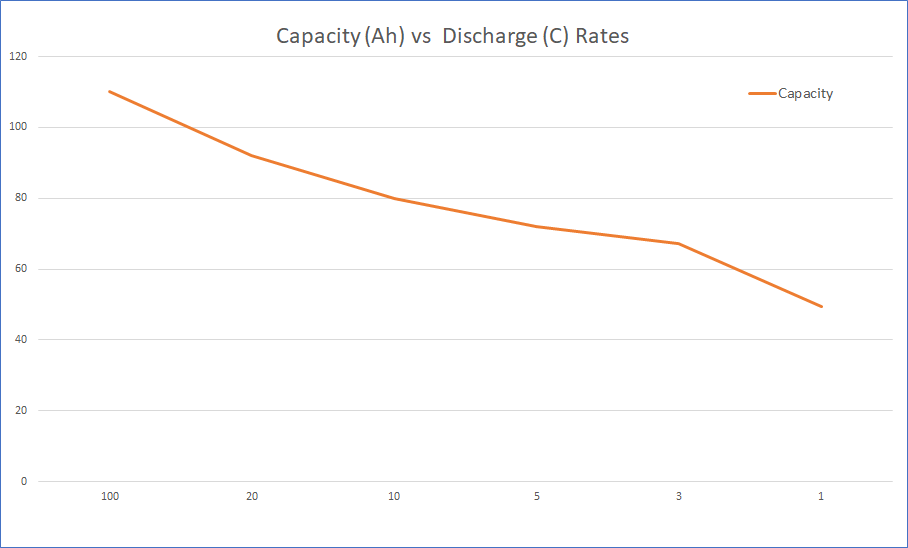
You won’t find a C80 Rating for most Batteries, but you get a good idea what that might be from the table the manufacturer provides. For example, the graph below shows the capacity plotted against the C rating (taken from the table shown earlier in this post) and you can follow the line to get a good idea what the Capacity for an unspecified C rating would be.
In the following table, the “C Rating” is the bottom/horizontal axis and the Capacity is the Side/vertical axis.
On the Victron BMV-712 meter, I have set the Battery Capacity using the C20 rating as per the Victon Recommendation and it has a setting for the Peukert Component which should manage the variance and provides me with the SOC (State of Charge), but is that accurate?
And what about monitors that don’t have that setting option? or people without Battery Monitors?
I am able to sample and log on a minute-by-minute basis the various data points such as current, voltage, SOC, etc, and so I thought I would check my own consumption to get an idea of what the Discharge Rating I have and to work out what Battery Capacity I really have, mapping each minute to a given C Rate based on current draw (and the way I allocated to the C rate was weighted to show the lower C Ratings for worse case)
The charts below show how long is spent at each Discharge Level for a 24 Hour Period.
In the first example, we are looking at a day at the end of April. The van was parked up so there was admittedly little use except for the Roof Fan, The Compressor Fridge coming on every so often and the Electric Water Heater coming on automatically once the battery hit a certain charge.
The Darker Bars is the amount of time the Battery Draw is in the various C Rates throughout a full day;
The Lighter Bars is the percentage time taking away that time when the Battery is getting a net charge (more going in than coming out);
And the Yellow Bar shows the percentage of the day where the battery is getting a net charge.

I actually created a “new” C Rating – C300 – which is a current draw 1/3rd of the C100 Rating or around 1/15th the draw of that of the ‘Recommended ‘ C20 Rating.
0.7% of the time I am drawing power is at the C1 Rating, 0.5% at the C3 and 0.5% at the C5 Rating, all of which are pretty high current draws, but in total represent a very small period of time. The great majority of the time (>85%) is spend at ratings of C100 or higher.
I have not worked out at this stage what the ‘real’ Battery Capacity is based on this, but I think it will be a fair bit better than the C20 rating.
Now let’s look at another day – this one being a bit more extreme … This next chart is a day taken from a weekend camping in a cold Scotland in Feburary. So no hookup, very poor solar, Heating on non-stop and tea-making & cooking using the Induction Hob.
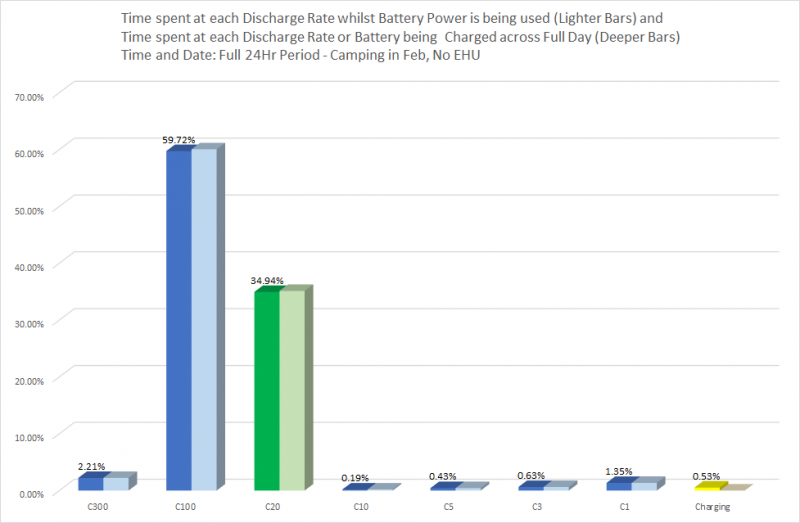
As you can see, there is virtually no net charge into the battery (it was actually just 11 minutes in a full 24 Hour Period).
The second chart shows a lot higher usage, but bearing in mind there was very poor solar performance that didn’t help the situation (for the day shown in the chart, the solar brought in 70Wh for the entire day; compare that to 1,350Wh for the day in April in the first chart).
And to answer the question “is C20 the right rating to use?“, for an off-grid Camper, configured to be able to run for days without hookup, I would say probably no.
As you can see from the two charts, the usage (of course) and the time of year makes a difference, but even with no recharging and a fair bit of use, nearly 2/3rds of the battery use was at the higher C100 Discharge rate.
Bearing in mind the typical Lead Acid Battery should not be taken below 50% (half capacity), if you were to base selection on actually using a battery on a C20 basis (so drawing 5% of the rated capacity per hour), your Battery Bank would only last 10 hours (less than half a day!) before it was in urgent need of recharge. A battery used that way would really only be suitable for a recreational vehicle that moves from hookup to hookups – so for example a typical caravanner.
On the plus side, it does mean if you are an off-grider, the chances are your battery bank will have a greater capacity than expected (compared to the C20 number) so you get a bit of extra leeway to play with if you did work to the C20 standard and so maybe an unexpected buffer
Now I said at the beginning “…I thought I would check my own consumption to get an idea of what Battery Capacity I really have”. So what is it?
This is the Capacity vs Discharge Rate chart built from the Leoch Table and shown in earlier, but this time with the real-life numbers added in to show where my batteries, when being used in a real-life installation fits into the laboratory C rating numbers.
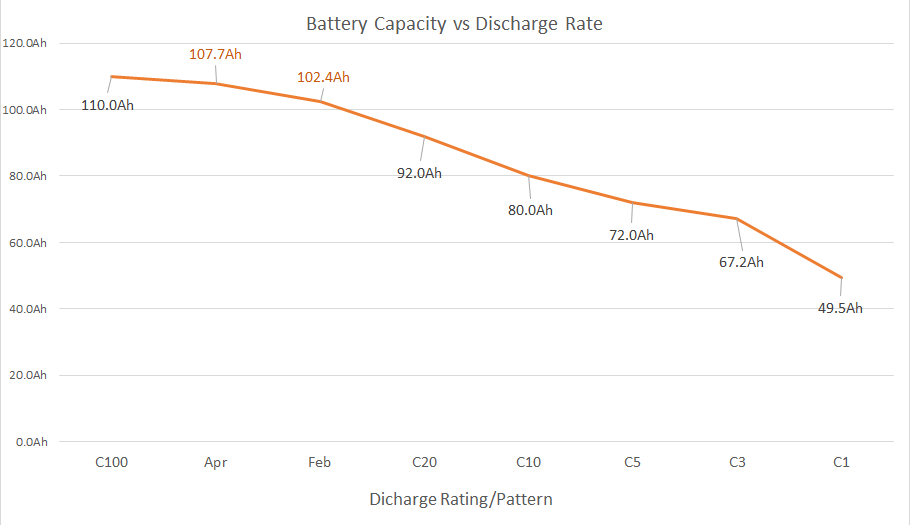
The two entries added are for Apr and Feb. They fit between the C100 and C20 in terms of Capacities. It is not possible to assign a “C” rating to them, but the battery capacity for April (a light use day) is around 15% greater than the C20 number, and the capacity for Feb (a fairly heavy day with the heating and electric hob use) is still 10% greater than the C20 number.
Also, my own Effective “C Rating” will be quite a bit lower than the typical camper as I use Electricity for functions that most others use Gas for, e.g. An Electric Compressor Fridge, Electric Induction Hob for Cooking rather than a Gas ring and even an Electric Water Heater.
Note that the above data and discussion is for Lead Acid Batteries. I have not confirmed this myself in real-world testing, but Lithium Batteries are not meant to have any reduction in the quoted total Ah capacity as current draws increase and so the expected chart line above would be a flat line. This means that for users of large inverters, a Lithium Battery setup should show a noticable benefit, and as the price of LiFePO4 batteries (the typical Lithium Battery technology recommended for Leisure batteries) is dropping, this option is becoming more affordable all the time.