Part 2
Previously ….
Part 1 of this discussion set talked about the theory behind having Lithium and Lead running – and physically connected – together. Here in Part 2 we are going to look at how this works in practice, and illustrate this with some detailed charts.
Please Note: The content here is provided as general advice and information and is not specific to YOU or YOUR vehicle.
It should be used at your risk, is not warranted or guaranteed in any way and we are not liable for any losses or damage that might occur.
If this is not acceptable to you and you do not agree to this, do not read any further.
The Background Data
Ok, time for some pretty pictures now.
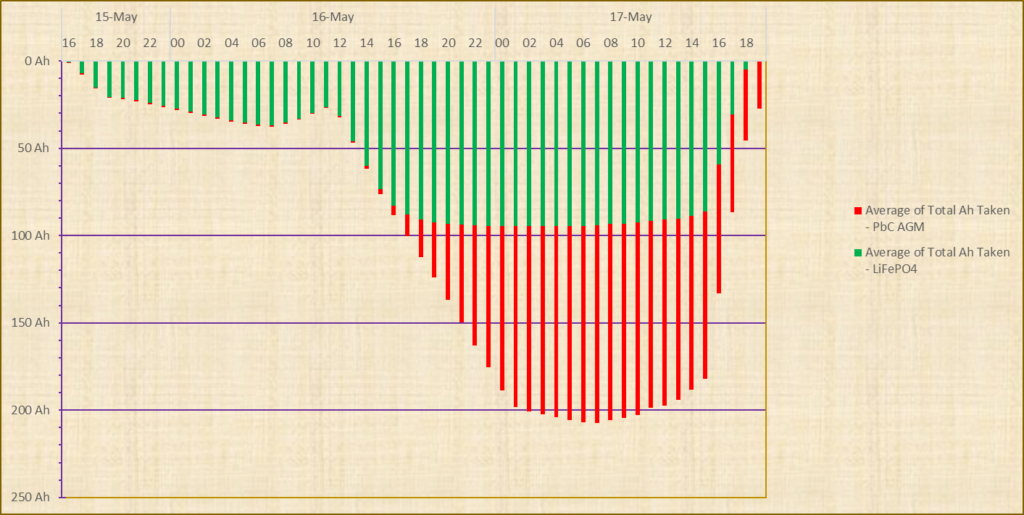
We are starting off with the batteries fully and 100% charged. I pulled the AC Hookup Plug and then sat back to see what happens… The chart shows how the Amphours are being taken out the battery bank to satisfy the load. It is a TOTAL view being shown with each battery types contribution identified. You will see this chart repeatedly, but with additional info overlaid to add some context to what is happening in the battery bank.
Day 1
On the previous chart you see the Green Bar (LiFePO4) only for nearly a full 24 hours. There is a very sight hint of red showing the Lead has provided some power, but it is noise really.
Day 2
At around noon on the 16th May the fridge comes on and starts taking power. The Green (Lithium) bar starts to grow and as each hour progresses the Red (Lead) bar starts to get bigger as it comes into play.
By around 18:00 on the 16th May, the LiFePO4 Battery has given up 90Ah – 90% of its capacity and the Lead Carbon starts to take over as the primary power source. Note this is completely automatic – there is no electronics involved in this process – not even the Lithium’s BMS which would not shut off until the battery hits 100% discharged.
The main system load is removed around 01:30 on the 17th May, and you can see the Ah Drawn increase starting to slow down. The load of the fridge may have disconnected, but there are still the other DC loads that have be fed of course.
Day 3
The next day (17th May) around 7:00 the Solar starts to wake up and there is some minor charging. As it looked to be a pretty poor harvesting day I got the AC power back on around 15:30 and the big ~70A charger in the Easyplus started to charge the battery bank.
The Lithium Battery recharges rapidly as that is what Lithium batteries tend to do and is a key benefit of them. The Lead Acid Bank continues to charge, albeit at a slower rate as that is typical of Lead Acid – so all is just as you would expect of each technology, despite them being physically connected together.
I have not included the time where the Lead Acid Bank continues to charge as it would not be that interesting.
Let’s start drilling down into the weeds now …
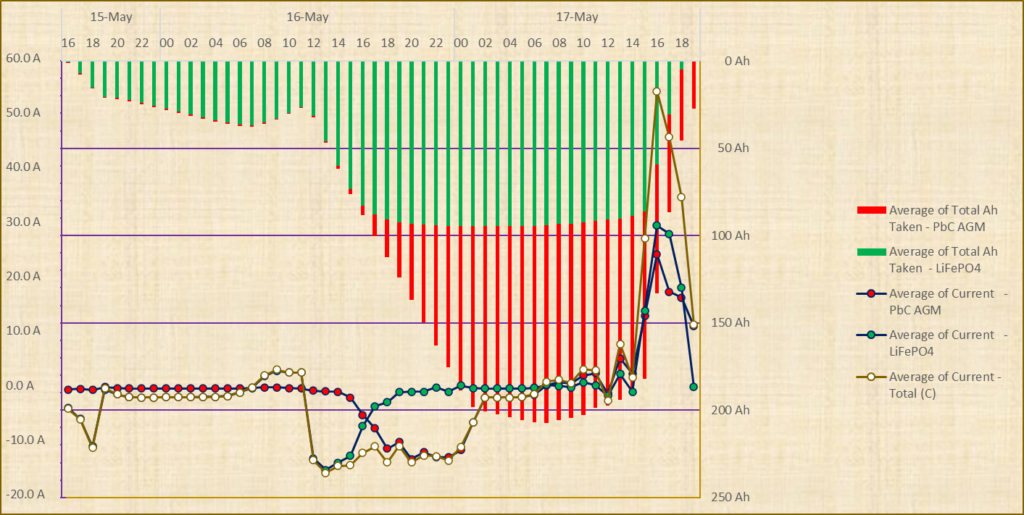
Similar chart as earlier but with a different focus. From now on, as we are focusing on other details linked to the Battery Consumption, I have moved the Ah axis to the right, and the ‘focus’ item has its axis to the left.
We will first look at the current draw for each battery (and we show the current as a whole also) and what that is doing to the Ahs drawn from the battery
The next graph goes down into more detail at the point the AC charger comes on around 15:30.
Note that I have reversed the order of the LiFePO4 and the PbC AGM Ah Use bars to better illustrate the charging pattern.
The current shoots up to around 60A courtesy of the Mains Charger. Here you see the green line – representing the current in/out of the Lithium battery is above the Red (Lead) line until around 18:30, at which point the battery is virtually full and then it drops rapidly to zero.
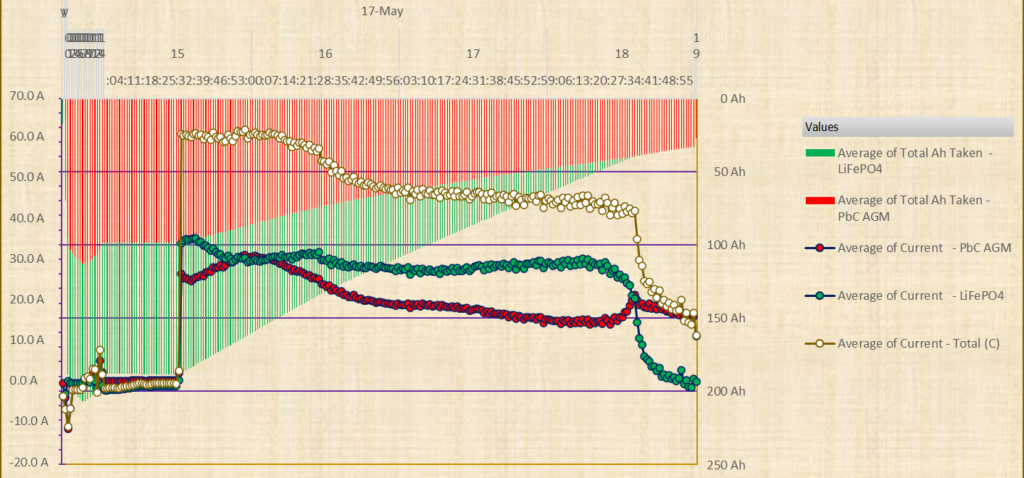
The Red bars – showing the AHs taken out the Lead Carbon Bank are reducing for sure, but the Green Lithium bars are on a much more pronounced reduction showing that a much more rapid recharge is taking place on the LiFePO4 battery.
I want to return to looking at the discharge of the battery and how it is switching over. Let’s look at that again, this time with a view of the Battery Voltage, as that is a key factor in this whole Hybrid thing if the maths are to be believed.

Let us now focus on the day of 16th May as that is the main discharge time
Things start to change around hour 16 (remember the hours before are averages for complete hours so the bigger jumps represent changes over a full hour rather than a minute by minute picture that we are viewing here).
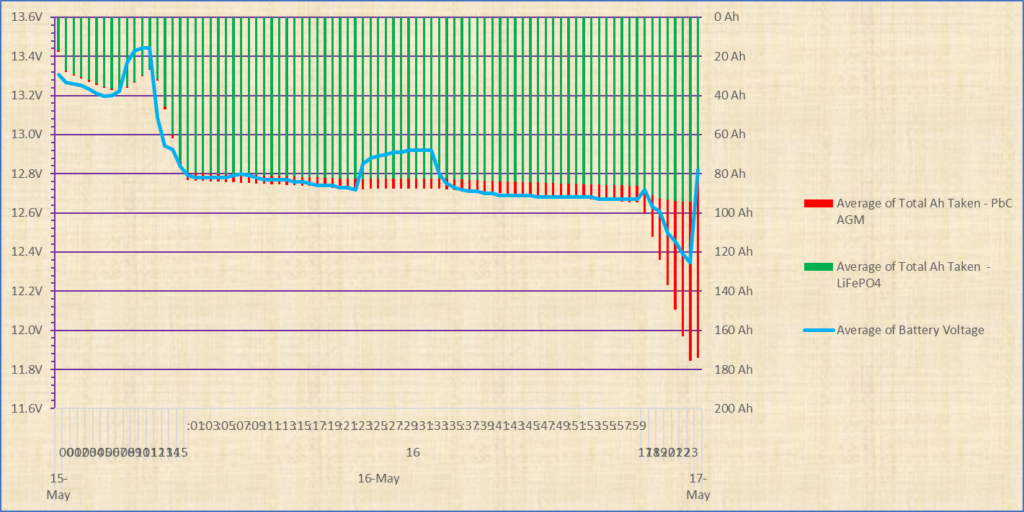
The Lead starts kicking in as the Voltage starts to dip below 12.8V, and as the voltage lowers gradually, the Lead gets used more. (By the way, the little recoveries in the Voltage are when the 200W fridge load stops so the voltage sag goes away).
If we look at the same time set with the current, it actually becomes clear the point the Lead takes over the reins …

16:50 is the cross-over point where more energy is provided by the Lead Carbon Battery Bank than by the Lithium Battery.
We can also take a view using the SoC (State of Charge) figures provided by the Battery Monitors. Now it is worth pointing out that working out the State of Charge of a battery is not an exact science and relies on various factors, so the numbers from the monitors are a pretty good indication and the Victron Monitors are just about the best in the business, but there are still variations even so.
Bearing that in mind here is the view of the time period we are focusing on above, followed by the general pattern for the time line.
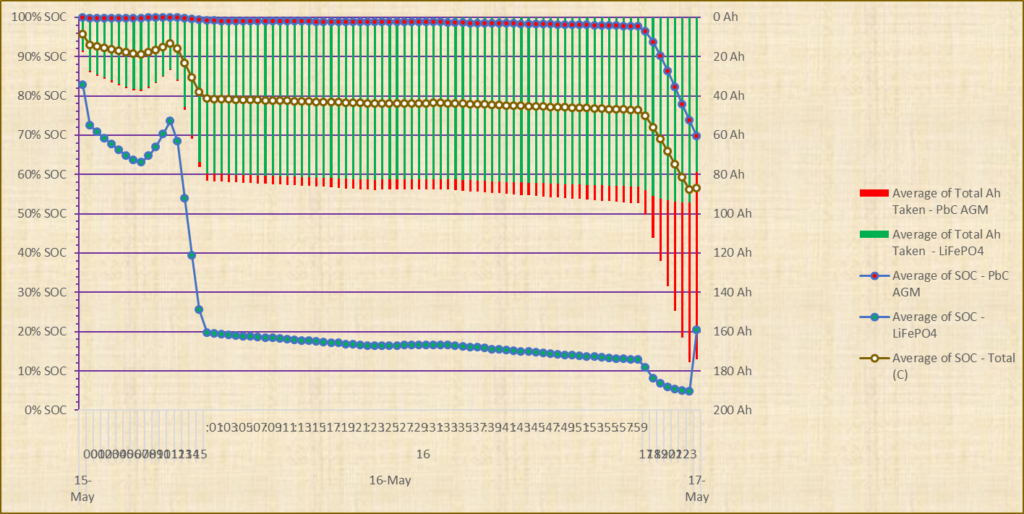
You see it dropping in line with the Amp-hours being taken out. The lines don’t look as dramatic on a minute by minute basis as the current graph as the SOC is a much slower changing metric.
A better indication for this comes from the wider timeline graph showing the SOC.
I have changed the presentation of the Ahs in this chart as it better illustrates how the SOC and the Ahs marry up, and how the each battery type is contributing at different stages of the time period depending on its level of charge. So here we have the total Ahs taken out the Hybrid Bank represented by the blue area, and the bars show how much of that is Lithium and how much is Lead at any time.
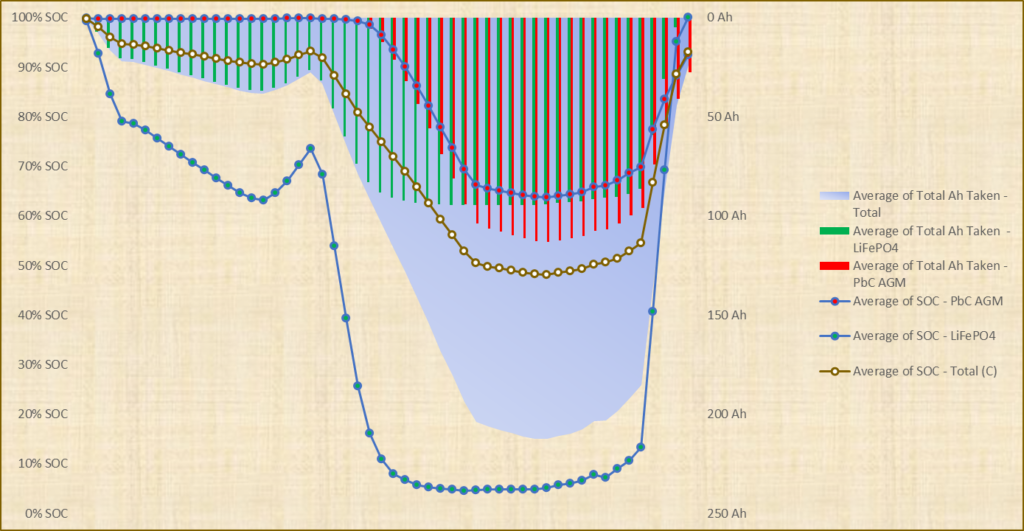
Here you see the SoC for the Lead-Carbon Battery Bank barely knocked off the 100% full point until the Lithium is down below 30% SoC. The LiFePO4 battery continues to contribute until it is down to about 5% SoC and then levels out and it is the Lead bank that provides the energy. This has been shown previously in essence with the Current graph, but the SOC provides a very useful ‘absolute’ context I think.
Notes on Charging
This section completes the analysis of how the different components of the Hybrid Battery Bank gets drawn under load and also some charging info. However there are some fairly important points to consider if having a Hybrid Battery Bank interests you. The next page will go into more details in these, especially around the charging aspect.